Wall Street futures signalling a slight increase of 0.1% at the opening of the trading day.
Commodity market, the oil price rises and continues to be trading around 50 dollars a barrel.
Month: May 2016
Breaking news – 10:30 (GMT+1)
The unemployment rate in the EU have reached to a low of seven-year
The Euro zone unemployment rate in April remained at 10.2%, according to forecasts.
However, the unemployment rate of the European Union’s fell to 8.7%, a record low of 7 years.
In May, the German unemployment rate reached a low of 6.1%, it’s lowest unemployment rate since 1990, the year then West Germany merged with East Germany.
Trading opportunity 10:00 (GMT+1)
GBP/JPY
On a daily chart the pair arrived to a strong resistance, around the level of 164.00.
At today’s high, the pair touched the level of 163.87.
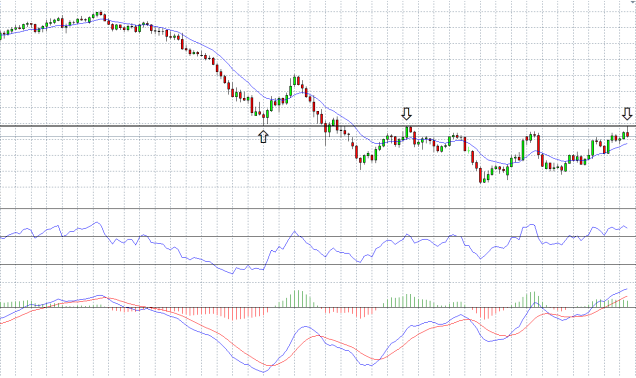
On 4 hours chart there is a bearish divergence at the indicators of MACD and RSI, compared to the last move of the pair.
Also, we got a bearish engulfing pattern.
For Forex traders:
Sell between the levels of : 162.75 – 162.00.
Stop loss point : 164.05
Take profit point : 157.15
For Binary options traders:
A put option between the levels of : 162.75 – 162.00.
Expiry time : June 10.
Market News Briefing – 08:30 (GMT+1)
Figures which was published today show that Japan’s industrial output in April unexpectedly rose by 0.3% compared to March,and compared of forecast of decline by 1.5%.
This figure suggests that the industry is holding up despite weak export data, and after a series of earthquakes that hit southern Japan in April.
Market News Briefing – 09:00 (GMT+1)
Due to the US Memorial Day who take place on Monday, the trading on Wall Street will resume on Tuesday.
Also tomorrow, Monday, there will be a bank holiday in the UK.
Market News Briefing – 08:30 (GMT+1)
Wall Street earnings season – the worst since the global crisis
The season financial statements for the first quarter came to a close on Wall Street and major US corporate profits have fallen sharply since the global financial crisis.
The earnings per share of 98.4% of the companies in the S&P 500 who have already published their statements regarding the first quarter, fell by 7% over the same period a year earlier, the sharpest fall since the third quarter of 2009.
The energy sector suffered from the fall in oil prices, with a decline 108% in the quarter.
Many energy companies posted heavy losses in the quarter, and a number of companies reached insolvency and bankruptcy.
Weakness was also recorded at the revenue of S&P 500, which shrank by 1.7% in the quarter – the fifth consecutive quarter of decline in revenues over the first quarter.
Market News Briefing – 13:30 (GMT+1)
For the first time in six months the price of the oil crossed the threshold of 50 dollars per barrel, after a drop in US crude inventories was recorded.
This decline has strengthened expectations for reducing the excess supply has in world oil markets.
Market News Briefing – 11:00 (GMT+1)
Growth slowing in the UK
The UK growth slowed to 0.4% in the first quarter of 2016.
Also, the UK business investment in the first quarter fell by 0.5%, this is the second consecutive quarter of decline.
Market News Briefing – 10:00 (GMT+1)
Spain’s economy continues to grow
Spanish statistics office reported that the domestic economy grew by 8% in the first quarter compared to the previous quarter, and by 4.3% compared to the same quarter last year.
Trading opportunity 09:30 (GMT+1)
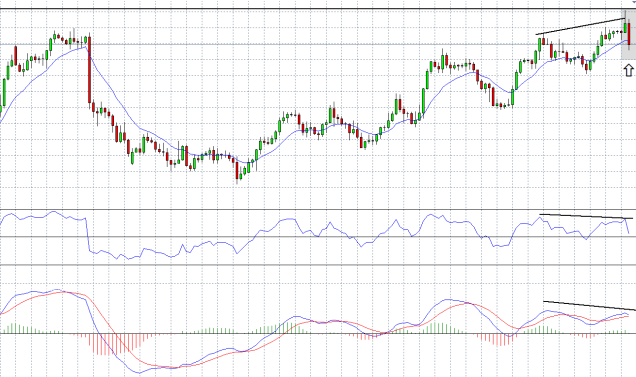
GBP/USD
On a daily chart we can see that yesterday the pair broke above a diagonal resistance line.
What we are waiting for?
There is a resistance around the level of 1.4700, we want to see a technical correction which will test this area of the break.
If the area will be strong enough to support the pair after the correction, then we will be looking to see a divergence at the indicators of MACD and RSI, together with a bullish pattern.
When all these elements will appear ,we will be able to place the entry and exit levels of the trade.
