Commodities
The price of a Oil barrel rising by 0.5% to a price level of 43.7 dollars per barrel.
The price of the Gold is going down by 0.2% to a price level of 1,264 dollars an ounce.
Commodities
The price of a Oil barrel rising by 0.5% to a price level of 43.7 dollars per barrel.
The price of the Gold is going down by 0.2% to a price level of 1,264 dollars an ounce.
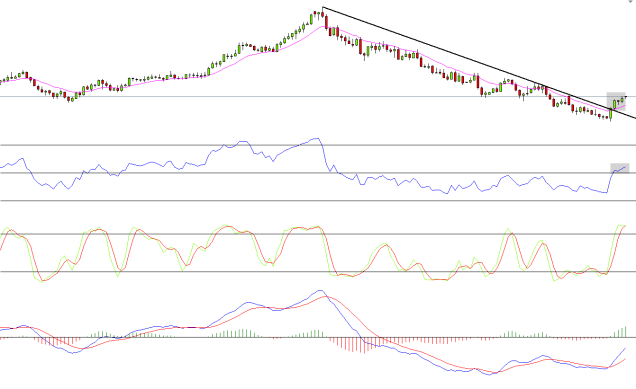
USD/JPY
Future trade opportunity.
The main trend of the pair is a downtrend.
On a daily chart we can see that the pair is on his way to test a descending diagonal line, as part of a technical correction (right now it stands at 109.05)
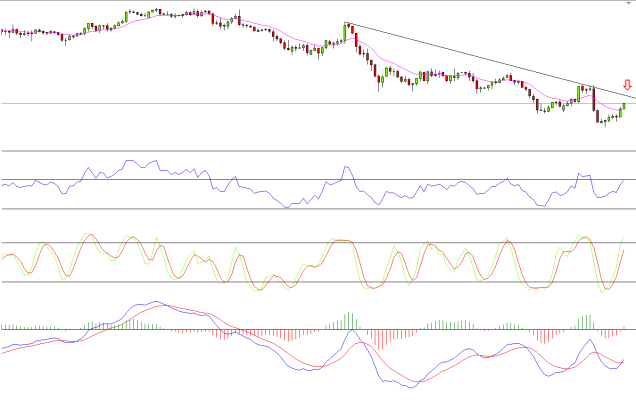
Around the level of 110.00 should be a resistance, once the pair will reach this level, we will be looking for a bearish pattern which would signal us about an opportunity to enter for a trade with the main downtrend.
We don’t have to wait for a bearish pattern only on a daily chart, we can also look for an entry situation on 4 hours and an hour chart, as soon as the pair reached to the resistance area.
For Forex traders:
Sell between the levels of : 110.30 – 110.00
Stop loss point :111.10
Take profit point : 107.00.
For Binary options traders.
A put option between the levels of : 110.30 – 110.00
Expiry time : May 20.
An increases of 0.5% is expected on Wall Street.
The future contracts on Wall Street pointing on gains of around 0.5% at the leading indices at the start of the US trading day, after yesterday it ended in a mixed trend.
GBP/USD
Yesterday we were looking for a rise of the pair after he tested a rising diagonal line.
Unfortunately the trade failed because the pair continued to plod around at the diagonal line, which is also a support area (the level of 1.4400)
This morning as we can see on 4 hours chart, there is another opportunity to look for a start of anew rise.
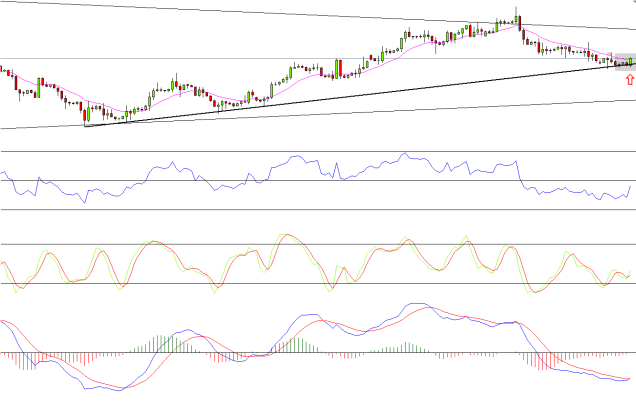
The pair created a bullish engulfing pattern and crossed above the 13 moving average.
Also, the averages of the stochastic oscillator made a cut facing up from an oversold area.
For Forex traders:
Buy between the levels of : 1.4420 – 1.4445.
Stop loss point :1.4380.
Take profit point : 1.4600.
For Binary options traders.
A call option between the levels of : 1.4420 – 1.4445.
Expiry time : May 10 at 20:00.
The inflation in China continued to rise.
The inflation in China rose in April for the third consecutive month, although it still below the government’s target.
According to data released today by the Bureau of Statistics in China, the consumer price index in China rose 2.3% in April and according to the Analysts forecasts.
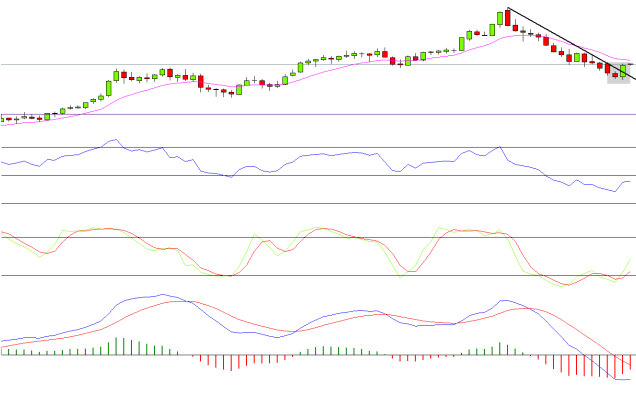
CAD/JPY
On a daily chart the pair created a bullish engulfing pattern yesterday.
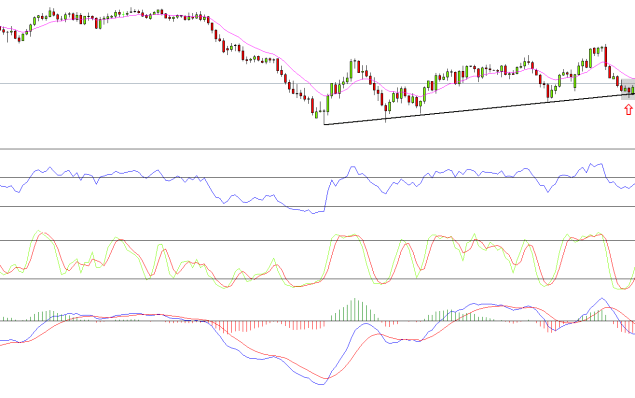
As seen on the daily chart, there is an up trend, and yesterday the pair rose after he tested a diagonal support line.
Also, the averages of the stochastic oscillator made a cut facing up from an oversold area.
For Forex traders:
Buy between the levels of : 83.50 – 84.00.
Stop loss point : 83.00.
Take profit point : 85.50.
For Binary options traders:
A call option between the levels of : 83.50 – 84.00.
Expiry time : May 13.
The future contracts on Wall Street signalling on gains of 0.3% in the leading indexes, in view rising oil prices.
The Oil price rises for the fourth day in a row, reflecting the drop in output due to the massive fire in Canada.
GBP/USD
On 4 hours chart we can see that the pair supported by a rising diagonal line.
Also, a bullish divergence is developing on the histogram of the MACD.
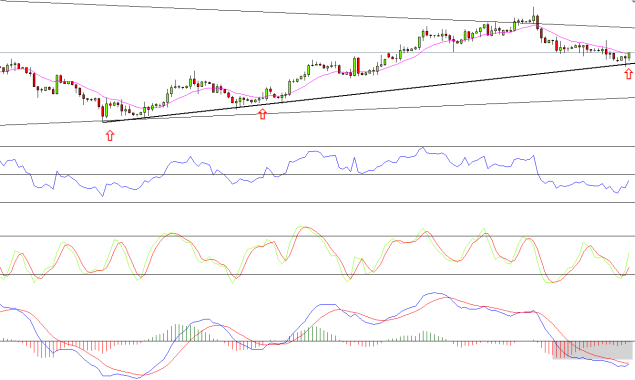
On an hour chart, we had a bullish candle that crossed up the 13 moving average, together with crossing the 50 level of the RSI.
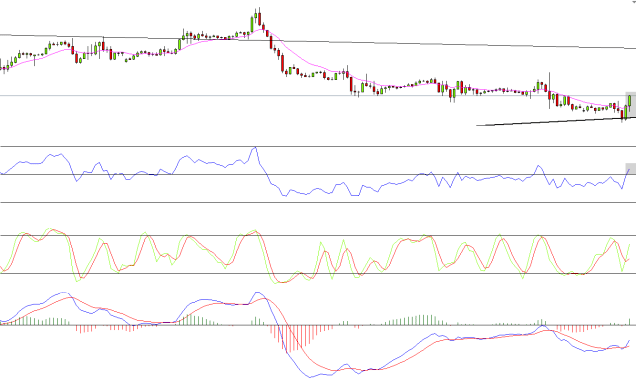
All these signaling us of a trading entry possibility.
For Forex traders:
Buy between the levels of : 1.4440 – 1.4460.
Stop loss point :1.4400.
Take profit point : 1.4580.
For Binary options traders.
A call option between the levels of : 1.4440 – 1.4460.
Expiry time : May 9 at 20:00.
A rise in orders of factories in Germany:
German factory orders surged in March, thanks to an increase in demand from outside the Euro zone.
According to data published today by the German Economics Ministry, the German manufacturing sector jumped by 1.9% in March from the previous month and beyond the analysts’ forecasts.
USD/CAD
Last week, as we can see on a weekly chart, the pair created a bullish engulfing pattern.
Not only that, it also broke up the descending resistance line of the last decline move.
Is this a good enough signal for entry to a trade?
The answer is yes, because on a daily chart we received a buy signal last week.
As seen, the pair broke up the descending resistance line, together with that, the pair crossed up the moving average (13) and the 50 level of the RSI.
For Forex traders:
Buy between the levels of : 1.2900 – 1.2950.
Stop loss point :1.2850.
Take profit point : 1.3250.
For Binary options traders.
A call option between the levels of : 1.2900 – 1.2950.
Expiry time : May 13 – May 20.
Good luck.
