Bank Of America
The price of the stock have reached to a resistance area, around the level of 15.00 and created a double top pattern, as seen on a daily chart.
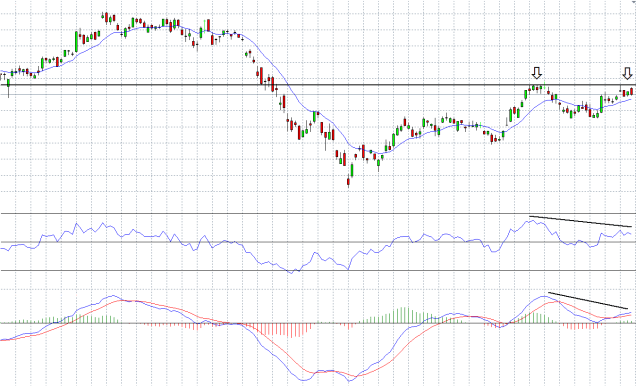
Alongside this pattern there is a bearish divergence at the indicators of MACD and RSI.
Yesterday the price of the stock went down by 0.74% and ended the trading day at the price level of 14.77.
For Forex traders:
Sell between the levels of : 15.00 – 14.75.
Stop loss point : 15.15.
Take profit point : 14.10.
For Binary options traders:
A put option between the levels of : 15.00 – 14.75.
Expiry time : June 3.
