Trading opportunity 10:00 (GMT+1)

EUR/JPY

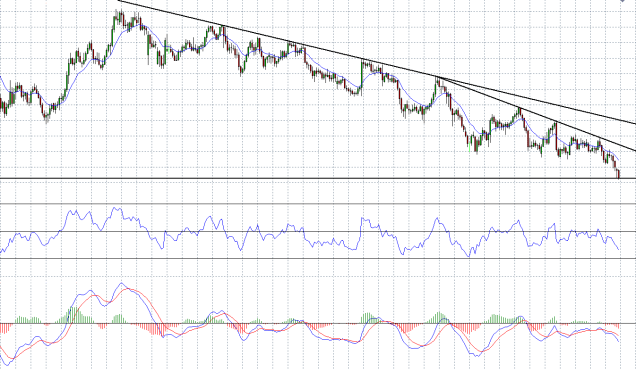
As we can see on the daily chart, the main trend of the pair is a downtrend.
The pair has arrived to a support area, around the level of 119.00.

eur.jpy d 14.6.16

On an hour chart we can see that a double bottom pattern is created, and at the indicators RSI and MACD a bullish divergence is developing also, but this yet to be implemented.

eur.jpy 1h 14.6.16
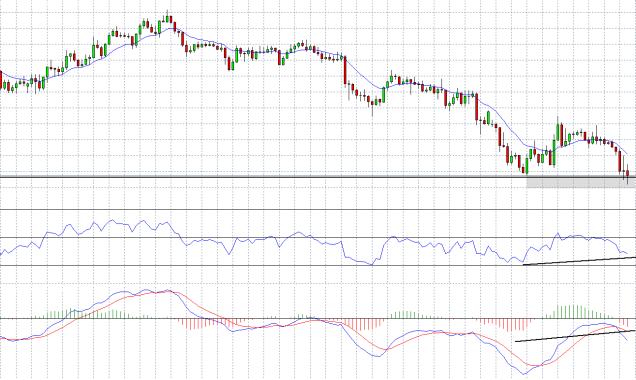
We are waiting for a bullish pattern that will put into effect this divergence, part of a  technical upward correction.

For Forex traders:
Buy between the levels of : 118.85 – 119.15.
Stop loss point : 118.50.
Take profit point : 121.00.

For Binary options traders:
A call option between the levels of : 118.85 – 119.15.
Expiry time : June 14, the end of the trading day.

Trading opportunity 14:00 (GMT+1)

NZD/USD

On a daily chart we can see that last week the pair has reached to a resistance area around the level of 0.7050, and when a false break pattern was formed.

nzd.usd d 13.6.16
On Thursday last week, the pair went up and closed the day at a price level of 0.7101, but on Friday it went down again and closed the week at the price level of 0.7053, on the resistance level.

For Forex traders:
Sell between the levels of : 0.7050 – 0.7025.
Stop loss point : 0.7115.
Take profit point : 0.6700.

For Binary options traders:
A put option between the levels of : 0.7050 – 0.7025.
Expiry time : June 17.

Trading opportunity 10:00 (GMT+1)

Coca cola

The main trend of the stock in an uptrend.
As we can see on a daily chart, last Friday the price of the stock rose by 0.52% and ended at a price level of 46.00 dollar a share.

coca cola d 13.6.16
All the indicators suggest about a good chance for continuity of the trend.

For Forex traders:
Buy between the levels of : 46.00 – 46.07.
Stop loss point : 45.75.
Take profit point : 48.00.

For Binary options traders:
A call option between the levels of : 46.00 – 46.07.
Expiry time : June 17.