Long term future trade
USD/CAD
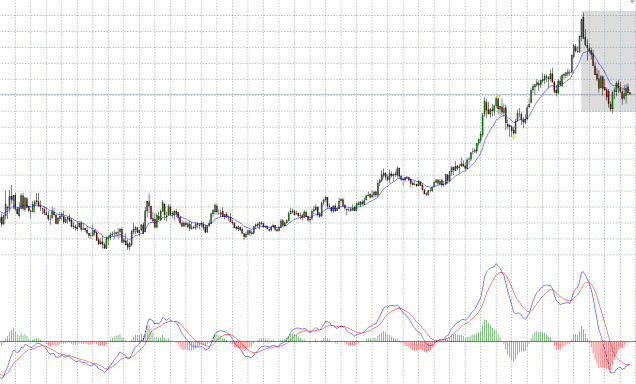
On a weekly chart we can see that the last main move of the pair was a down move.
Over the last two months there was a technical correction which came after the big drop.
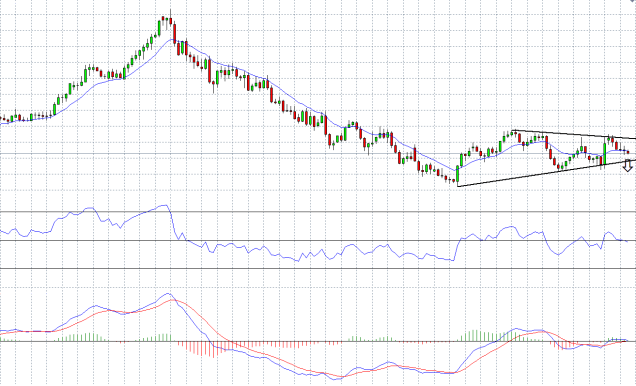
On a daily chart we can see that this technical correction reflected in creating a triangle pattern.
What we are waiting for?
Our first target is to see the pair continue to move down to break the lower triangle line.
As soon as the pair will break below the price level of 1.2800, it will be our signal of entering with the main downtrend.
For Forex traders:
Sell between the levels of : 1.2800 – 1.2750.
Stop loss point : 1.3200.
Take profit point : 1.2000.
For Binary options traders:
A put option between the levels of : 1.2800 – 1.2750.
Expiry time : August 30
