USD/JPY
On a weekly chart we can see that 4 weeks ago the pair broke down a support area, around the level of 105.00.
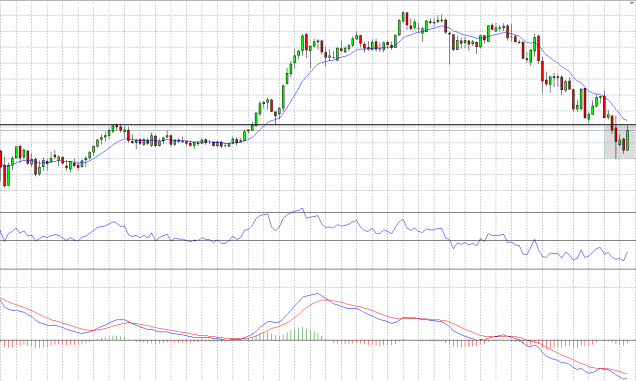
So far this week, the pair went up to retest what was a support area and now should act as a resistance.
On 4 hours chart we can see a closer look of this move and how so far the level of 105.00 is acting as a strong resistance.
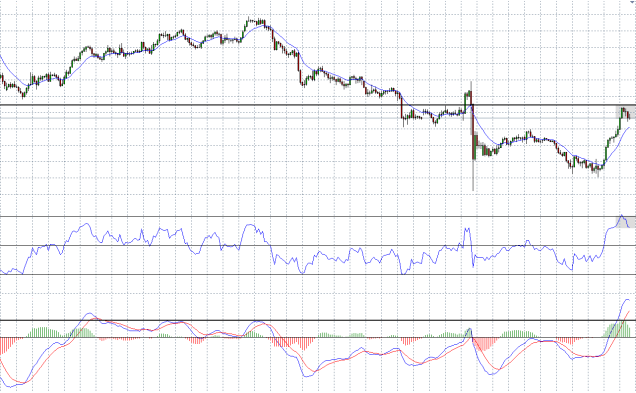
There is a bearish divergence at the histogram of the MACD, the last height of the histogram is higher than the previews ones together with the average of the RSI at an overbought level of 80.
For Forex traders:
Sell between the levels of : 105.00 – 104.30.
Stop loss point : 105.50.
Take profit point : 98.00.
For Binary options traders:
A put option between the levels of : 105.00 – 104.30.
Expiry time : August 30
