Trading opportunity 14:00 (GMT+1)

Silver

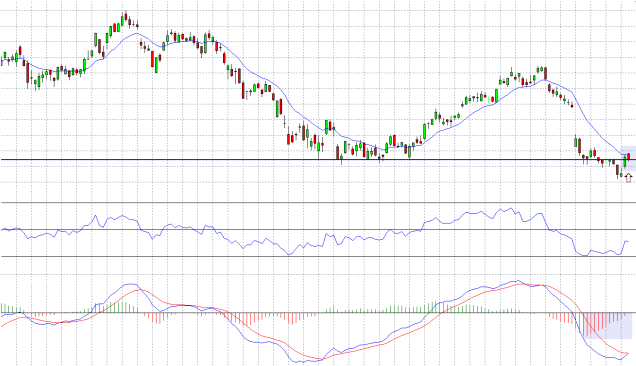
The main trend of the Silver is an uptrend as we can see on a daily chart.

silver d 19.5.16
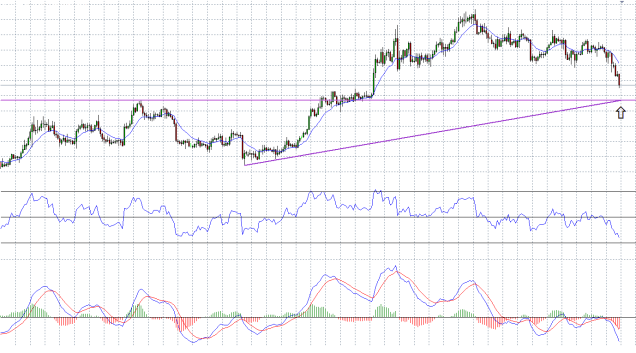
During the last 3 weeks, there is a decline, part of a technical correction, and the price is moving towards a support area of 16.00.

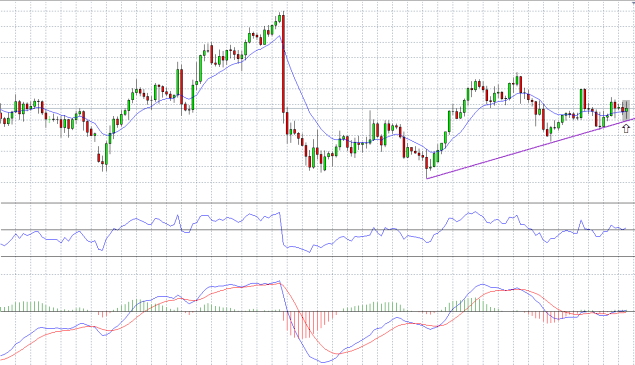
On 4 hours chart there is a diagonal support line who can meet with the price around the 16.00 level, if the technical correction will make its way to test this level.

silver 4h 19.5.16

What are we waiting for?

First we are waiting for the price of the silver to continue the technical correction, until it will stops around the level of 16.00.
Then we will be waiting for a bullish pattern to appear, from a daily chart and up to an hour chart.
After a strong bullish pattern will appear, we will be able to enter with a trade which will continue with the upward trend.

For Forex traders:

Buy between the levels of : 16.00 – 16.10.
Stop loss point : 15.80.
Take profit point : 18.00.

For Binary options traders:
A call option between the levels of : 16.00 – 16.10.
Expiry time : The end of June.

Trading opportunity 10:00 (GMT+1)

EUR/JPY
The main trend of the pair is a downtrend but on 4 hours chart we can try an enter to an intra-day trade, a part of a technical correction up.

As seen on the chart, there is a diagonal support line which supporting the pair 4 times in the last 10 days.

eur.jpy 4h 19.5.16
The last 4 hours candle was a bullish one which crossed up the moving average 13, with that, the average of the RSI is above his 50 line.

For Forex traders:

Buy between the levels of : 123.50 – 123.70
Stop loss point : 123.00
Take profit point : 125.50.

For Binary options traders:
A call option between the levels of : 123.50 – 123.70
Expiry time : The end of May 19.

Trading opportunity 12:30 (GMT+1)

APPLE

The recent trend of the stock is a downtrend and so far in 2016 it went down by 16%.
In the last few days the stock have reached a support area, around the level of 93.40, a strong support area as we can see on a weekly chart.

apple w 18.5.16

On a daily chart we can see that battle of the last few days around this support area, at first the price of the stock broke down this level but soon after the price went up above it.
The price went up also because of a tailwind which came after Berkshire Hathaway (BRKA), the conglomerate run by Warren Buffett purchased more than 9.8 million shares in Apple during the first quarter (It was Berkshire’s first investment in Apple)

apple d 18.5.16

As we can see on the daily chart, beyond that the price is next to a support area, against the last decline of the price of the stock, there is a bullish divergence at the histogram of the MACD.

For Forex traders:

Buy between the levels of : 93.00 – 93.40
Stop loss point : 92.60.
Take profit point : 98.00.

For Binary options traders:
A call option between the levels of : 93.00 – 93.40
Expiry time : The end of May.