Trading opportunity 11:00 (GMT+1)

IBM

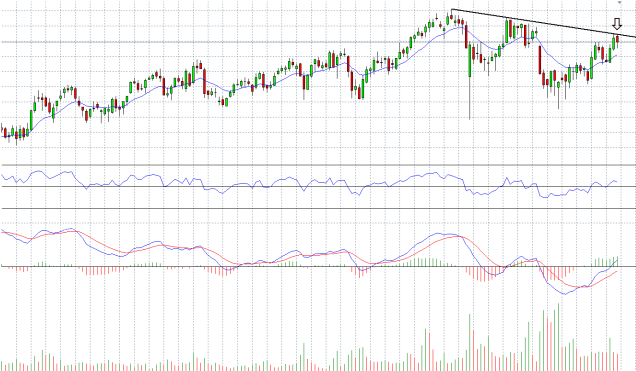
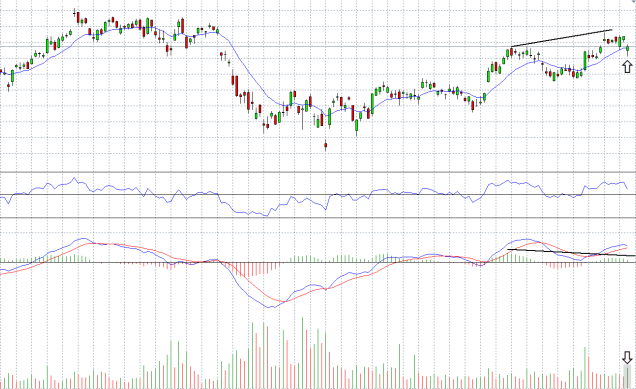
The price of the stock plodding at a range of a strong resistance area, around the level of 153.50, as seen on the daily chart.

ibm d 8.6.16
Over the last few days, the histogram of the MACD indicator is sloping downward, and creates a bearish divergence.

For Forex traders:
Sell between the levels of : 153.50 – 153.30.
Stop loss point : 153.95.
Take profit point : 149.00

For Binary options traders:
A put option between the levels of : 153.50 – 153.30.
Expiry time : June 17.

Trading opportunity 13:00 (GMT+1)

Bank Of America

The main trend of the stock is an uptrend, as seen on a daily chart.

bank of america d 7.6.16
Last Friday the price of the stock has arrived to a diagonal support line, and rose by 0.69%.
With this rise, the average of the RSI rose above his 50 level.

For Forex traders:
Buy between the levels of : 14.50 – 14.60.
Stop loss point : 14.35.
Take profit point : 15.15.

For Binary options traders:
A call option between the levels of : 14.50 – 14.60.
Expiry time : June 7.

Trading opportunity 11:00 (GMT+1)

AUD/USD

The main trend of the pair is a down trend,
On a daily chart we can see that the pair has reached to a resistance area, around the level of 0.7450.

aud.usd d 7.6.16

On an hour chart, against the latest move of the pair on the way to the resistance area, a bearish divergence develops and we are waiting for a bearish pattern to appear, which will carry out the divergence.

Also, the average of the RSI is at overbought level.

aud.usd 1h 6.7.16

For Forex traders:
Sell between the levels of : 0.7450 – 0.7430.
Stop loss point : 0.7505.
Take profit point : 0.7100.

For Binary options traders:
A put option between the levels of : 0.7450 – 0.7430.
Expiry time : June 10.

Market News Briefing – 09:00 (GMT+1)

The Fed chairman Janet Yellen spoke yesterday at an economic conference in Philadelphia and said that shouldn’t ascribe too much importance to the disappointing employment report which was released last Friday.
According to the Fed Chairman, the general trend is of a recovery in the labor market. Yellen said that the interest rates will rise gradually this year but she didn’t mention a specific time.
The markets interpreted this as a rejection of a rate rise this month and the stock markets closed with gains.

Trading opportunity 13:30 (GMT+1)

JP MORGAN

On a weekly chart we can see that the stock has reached last week to a diagonal resistance line which faced down.

jpm w 6.6.16

On a daily chart, last Friday, the stock went down with by 1.79% with a gap down, and was closed at a price level of 64.61 when the trading volume was high.
Also, there is a bearish divergence which is already underway.

jpm d 6.6.16

For Forex traders:
Sell between the levels of : 65.00 – 64.50.
Stop loss point : 65.20.
Take profit point : 62.00.

For Binary options traders:
A put option between the levels of : 65.00 – 64.50.
Expiry time : June 10.