Trading opportunity 12:30 (GMT+1)

APPLE

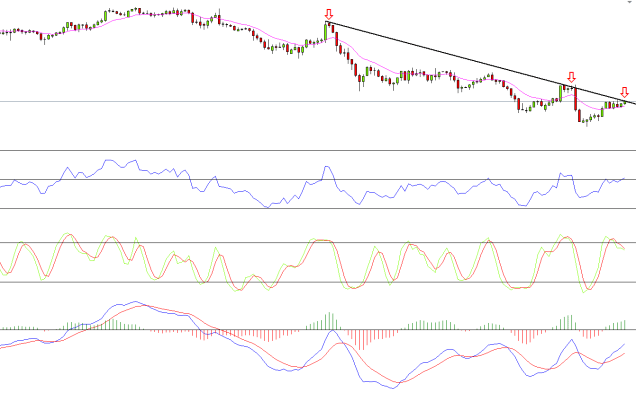
The recent trend of the stock is a downtrend and so far in 2016 it went down by 16%.
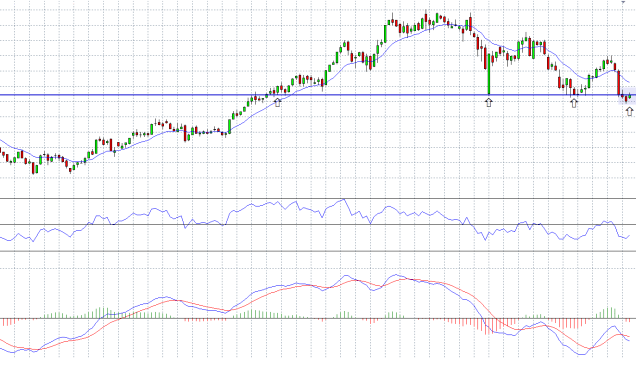
In the last few days the stock have reached a support area, around the level of 93.40, a strong support area as we can see on a weekly chart.

apple w 18.5.16

On a daily chart we can see that battle of the last few days around this support area, at first the price of the stock broke down this level but soon after the price went up above it.
The price went up also because of a tailwind which came after Berkshire Hathaway (BRKA), the conglomerate run by Warren Buffett purchased more than 9.8 million shares in Apple during the first quarter (It was Berkshire’s first investment in Apple)

apple d 18.5.16

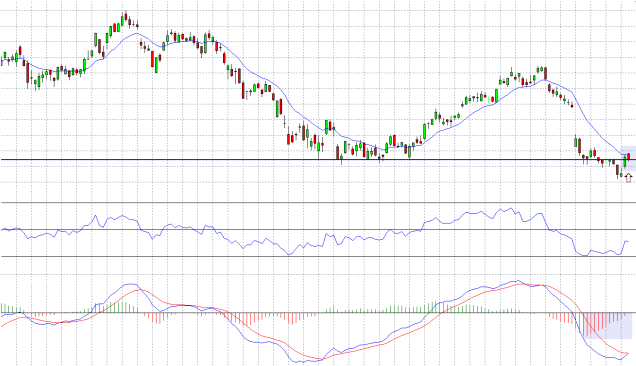
As we can see on the daily chart, beyond that the price is next to a support area, against the last decline of the price of the stock, there is a bullish divergence at the histogram of the MACD.

For Forex traders:

Buy between the levels of : 93.00 – 93.40
Stop loss point : 92.60.
Take profit point : 98.00.

For Binary options traders:
A call option between the levels of : 93.00 – 93.40
Expiry time : The end of May.

Market News Briefing – 13:00 (GMT+1)

News from the USA

The future contracts on Wall Street show a slight price declines of around 0.1% in the leading indices.
Yesterday the trading day closed with sharp gains.

Apple shares rising by 0.5% before the opening of the trading day, after yesterday it jumped by 3.7% following an exposure about Berkshire Hathaway holding company of the billionaire Warren Buffett, which acquired 9.8 million shares of consumer electronics giant in the first quarter.

Trading opportunity 09:00 (GMT+1)

USD/JPY

The main trend of the pair is a downtrend, as seen on a daily chart.

usd.jpy d 17.5.16
In the last two weeks the pair made his way to re-test a resistance diagonal line.
The current resistance level is 109.50, next to resistance line.

What we are waiting for?
First we are waiting to see that the pair will stop at this resistance area, then we’ll be waiting for a bearish pattern, it can be on lower time frames of 4 hour or an hour chart.
Another option is to see the pair crossing above the resistance line and then dropping back below it, this kind of a false break will be a good entry signal as well.