Trading opportunity 10:30 (GMT+1)

INTEL

Long term trade

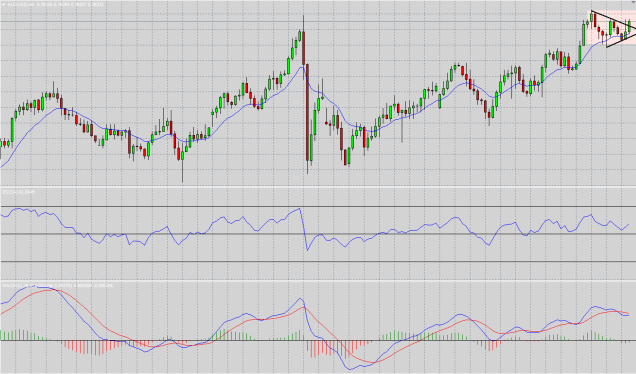
On a weekly chart we can see that the price of the stock rose and broke above a triangle pattern as part of his rising trend.

intel d 18.7.16
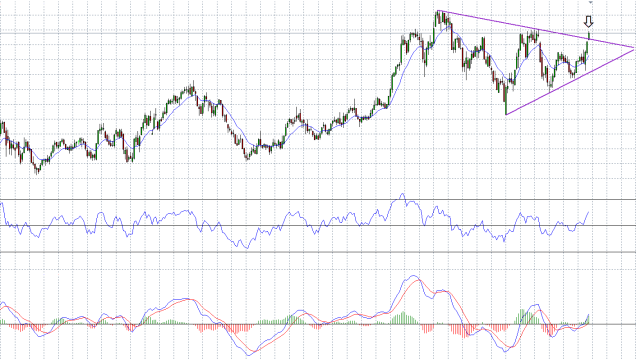
Last week the stock ended at the price level 35.07.
The trading volumes were high and the indicators of MACD and RSI supports this trend.

For Forex traders:
Buy between the levels of : 35.00 – 35.30.
Stop loss point : 30.00.
Take profit point : 45.00.

For Binary options traders:
A call option between the levels of : 35.00 – 35.30.
Expiry time : end of the day, September 30.

Market News Briefing – 08:00 (GMT+1)

Stock market abstract background

The Turkish Lira is recovering this morning after an unsuccessful coup attempt which shook the country and the local currency.

State officials tried yesterday to reassure investors before the opening of the trading day this morning, and promised that the central bank will provide the liquidity required for business entities.

Trading opportunity 10:00 (GMT+1)

images

AUD/USD

The pair is on a rising trend as we can see on 4 hours chart.
A triangle pattern was created and at the end of the hour the pair broke up the upper triangle line.

aud.usd 4h 14.7.16
It’s a good opportunity to enter to a trade with the trend.

For Forex traders:
Buy between the levels of : 0.7600 – 0.7650.
Stop loss point : 105.90.
Take profit point : 0.7740.

For Binary options traders:
A call option between the levels of : 0.7600 – 0.7650.
Expiry time : end of the day, July 14.

Market News Briefing – 14:30

The global stock market erased all the falls that followed the announcement of the British exit from the EU

Wall Street stock markets traded in a positive trend for the fourth day in a row and the Dow Jones and S&P 500 continue to break records, in anticipation of the periodic report of the Federal Reserve on the state of the US economy, and also because of an encouraging results of US financial season which started this week.