Daily market review – April 19th 2017

Paxa7aH

In Asia today the trading ended with a negative trend in most of the leading stock exchanges, at the background of the falls in prices on Wall Street last night.
Yesterday, the London Stock Exchange shed 2.5% on the day after Prime Minister May announced that the elections would be held on June 8, and this morning the British stock exchange is down 0.2%.
This coming Sunday, another event is expected to shake Europe in particular and the financial markets in general – the first round of the French presidential elections.
The continued tension between the US and North Korea also does not add health to market players.

Trading Opportunity
USD/JPY

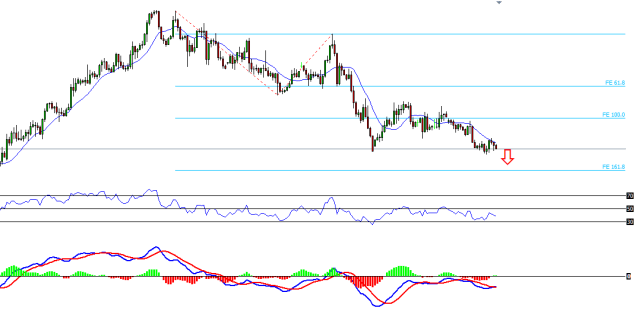
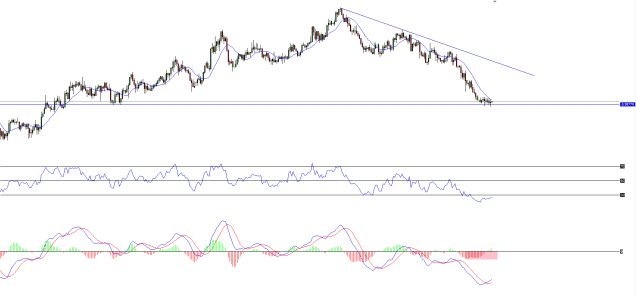
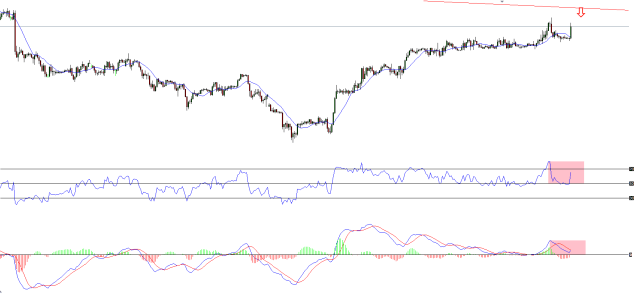
On the daily chart the pair reached the 100.0 level of the Fibonacci Extension (around 108.50) completing a double wave down.

usd.jpy d 19.4.17
There is a bullish divergence at MACD which can be a sign of the end of the trend.

What can we do from here?
Our trigger for a buy CALL options would be in a lower time frame.

usd.jpy 1h 19.4.17

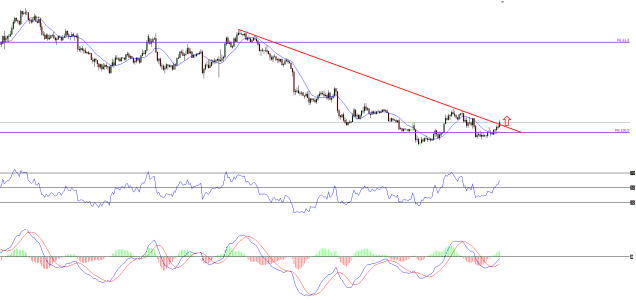
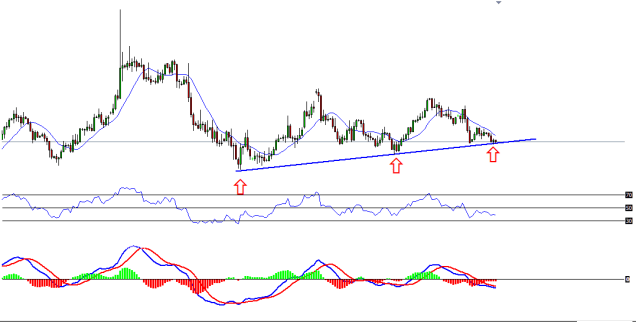
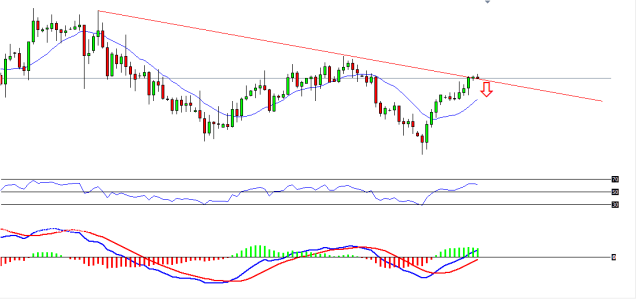
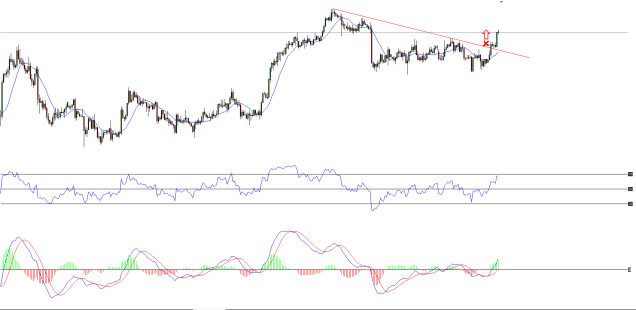
On an hour chart the pair broke above a downtrend line (108.80)
We can try and enter the trade from this point.

Daily market review – April 18th 2017

iStock_000022490752Medium

The trading in Asian stock exchanges was with a mixed trend today, with a tendency of declines in most of the leading indexes, at the background the geopolitical tension between the US, North Korea and Russia is hovering in the background.
Yesterday, the trading on Wall Street’s leading indexes posted a sharp gains in the past six weeks.
After falling by 1.1% last week to a two-month low, the S&P 500 jumped by 0.86%
China reported yesterday that its annual growth rate climbed to 6.9 percent in the first quarter, above expectations of a 6.8 percent growth rate.

Trading Opportunity
AUD/NZD

On the daily chart we can see that the pair has reached a support line around the level of 1.0770.

aud.nzd d 18.4.17

This level was acting as a resistance up until the start of March, when then it was broken up.
Right now the pair is testing this area for the first time since the break, and as long as the support hold the pair above this level, our tendency is to buy CALL options.

Daily market review – April 14th 2017

6978117-japanese-flag-wallpaper-hd

Wall Street indexes closed yesterday with declines.
The Dow Jones Industrial Average lost 0.7%, the S&P 500 fell by 0.7% and the NASDAQ index retreated by 0.5%.

The trading on Asian stock exchanges is being led by price declines against the backdrop of rising geopolitical tensions.
Tokyo fell by 0.5%, Shanghai weakened by 0.9%, Seoul fell by 0.6%.

In the forex market, the US dollar was trading against the Japanese yen with a falling more than 0.1% to around 108.94 yen per dollar, a record for the Japanese yen since November 14.

Today there is no trading in Sydney, Hong Kong, European stock exchanges and Wall Street due to Easter.

Trading Opportunity
AUD/CAD

We are following this opportunity during the last few days.
On the daily chart, after completing a double wave down that ended at the level of 161.8 of the Fibonacci exponential (between the levels of 0.9920 – 0.9960) the pair started to go up.

aud.cad d 14.4.17

How can we join in?

On the 4 hours chart we can the see a resistance trend line.

aud.cad 4h 14.4.17
First we are waiting to see the pair reaching the resistance line (around the level of 1.0120).
Then we want to see a small correction down, and after that a break above the resistance line which will create a new wave up.
On this wave we can join with a CALL trade.

Daily market review – April 13th 2017

Money tree

Wall Street indexes closed yesterday with declines for the second day in a row on the back of continued geopolitical uncertainty about US moves toward Russia, Syria and North Korea.
The S&P 500 retreated by 0.4% on its way to a sixth decline in the last nine trading days.
The NASDAQ Lost 0.5% and the Dow Jones Industrial Average fell by 0.3%.

The US dollar weakened against the world’s major currencies after US President Donald Trump said in an interview with The Wall Street Journal that the US currency is getting too strong.

The trading on Asian stock exchanges is trading in a negative trend, following the trend on Wall Street last night.
Tokyo is down by 1.1%, Hong Kong is losing 0.1%, Shanghai is up by 0.1%, Seoul is up 0.4%, Sydney is down by 0.8%.

The exports from China jumped by 14.8 percent in the first quarter of 2017 compared to the same period a year earlier.
The imports also jumped by 31.1%.
The sharp increase in exports led to a surplus in China’s trade balance of 66.01 billion dollars.

Trading Opportunity

EUR/GBP
A CALL Opportunity After A Triple Cycle.

On the daily chart the pair is approaching a support line.

eur.gbp d 13.4.17

What we are waiting for?

On the 4 hours chart the pair is on his way to finish a triple cycle down move.

eur.gbp 4h 13.4.17
First we want the pair to goes down to the 161.8 Fibonacci exponential level, around the area of 0.8440.
From there we can try and make a CALL order.

Daily market review – April 12th 2017

stockvault-dollar-sign115174
Oil continues his longest rally since December.
WTI crude oil rose by 0.2% to $ 53.5 per barrel and Brent crude oil rose by 0.3% to $ 56.4 a barrel.
The trading in Asian stock exchanges is on the decline in light of the strengthening of the Japanese yen and fears of escalation in the security tensions between the US, Syria and North Korea.
Tokyo is down by 1.2%, Hong Kong is down by 0.2%, Shanghai is losing 0.3%, and Seoul is trading slightly up 0.1%.
Singapore and Sydney are trading unchanged.
The Japanese yen is strengthening against the US dollar to its highest level this year. The dollar weakened against the yen to 109.54 yen per dollar.
The Euro and the pound weakened slightly against the dollar to $ 1.0602 and $ 1.2484 respectively.
China’s producer price index rose by 7.6 percent in March from analysts’ forecasts of a 7.5 percent rise and a 7.8 percent rise in February.
This is the fastest annualized increase since 2008, but the fall in February indicates a slowdown in industrial growth.
Trading Opportunity
AUD/CAD
There is a CALL opportunity on this pair.
After a downtrend, on a daily chart the pair reached a support area, around the level of 0.9980.
aud.cad d 12.4.17
The RSI indicates of a decrease in volume of the power of the sells.
How can we act from here?
On 4 hours chart there is divergence against the range which was develop on the support area in the last few hours.
aud.cad 4h 12.4.17
We can try and buy the pair from here.
The next level the pair should be reached is 1.0095.

Daily market review – April 10th 2017

Trading And Investing

Wall Street markets closed on a negative trend on Friday, following a disappointing job report in the United States, where only 98,000 jobs were added to the US job market, while the economists’ forecasts were for a 180,000 increase in March.
Another reason for the fall in prices is the attack of the US military in Syria.
Summing up the week:
The S&P 500 shed 0.3%.
The Dow Jones Industrial Average closed lower by 0.1%.
The NASDAQ index fell by 0.6%.

Toward the end of the week, the Wall Street reporting season is expected to open as investors expect for the first time since 2014 the S&P 500 index will posting a double-digit increase in profits.
If the earnings will be disappointing, some investors may realise that the rally in recent months on the US stock markets were exaggerated and that prices are inflated.

Trading Opportunity
USD/CHF

We are following this pair and a trading opportunity since last week.

On the daily chart we can see that the pair has arrived to a resistance trend line, between the levels of 1.0090 – 1.0100.

usd.chf d 10.4.17
Our tendency is to sell around this resistance. How do we do that?

On the hour chart we can see that the pair started his way down.

usd.chf 1h 10.4.17
The first option is to sell straight away.
The second option is to wait for a small technical correction up, and then we can join in with the downtrend of the second wave down.

Daily market review – April 7th 2017

Energy_TundraOaG_01

Wall Street markets closed with a small rise yesterday with the uncertainty over the results of the US and China presidents’ summit – the two largest economies in the world – and ahead of the release of the US employment report today.

The NASDAQ Composite Index rose by 0.3%, the S&P 500 added 0.2%, the Dow Jones Industrial Average rose by 0.1%.

The US attack on Syria overnight has caused a significant weakening in earlier gains on Asian stock exchanges, and investors flocked to safe assets in the moments after the attack.

In the foreign currency market, the Japanese yen, which is considered a safe haven for investors, rose by 0.2 percent against the US dollar and traded around 110.57 yen per dollar.
The uncertainty in the Middle East usually leads to an increase in oil prices – which is the case today.
WTI crude oil rose by 1.7% to $ 52.56 a barrel and the Brent oil rose by 1.5% to $ 55.7 a barrel.

Trading Opportunity
GBP/USD

gbp.usd 4h 7.4.17

We are following this opportunity for some days now.
After a move of a rise, there is a price convergence which created a triangle pattern (as seen in 4 hours chart).
Our main tendency is to wait for the Pound to get stronger against the US dollar and to climb above the the upper line of the triangle.
If so, it will be a good signal to buy the pair.

Daily market review – April 6th 2017

redtogreen

The trading on the Wall Street stock exchanges closed yesterday with price declines that began towards the close of trading, following a positive trend from the publication of a strong employment report in the US private market.
The ADP employment report pointed to an addition of 263,000 jobs in the private market in March, well above the forecast of an additional 170,000 jobs and an improvement from February’s 245K jobs.

Yesterday the meeting of the Federal Reserve were published and according to it, bank officials want to reduce the balance of $ 4.5 trillion, meaning that the bank wants to sell some of the bonds it has accumulated over the past few years, and investors believe that the pace of interest rate hikes in the US will slow if the bank starts selling bonds.

On a daily summery:
The Dow Jones Industrial Average fell by 0.2%, the S&P 500 shed 0.3% and the Nasdaq lost 0.6%.

This morning, the price of the oil is trading in declines, but the price remained above $ 50.
The TWI is down by 0.5% to $ 50.8 per barrel and the Brent crude is down 0.5% to $ 54 a barrel.

Activity in China’s services sector in March grew at a slow pace for the third month in a row.
China’s services sector PMI fell to 52.2 points from 52.6 in February and the lowest in six months.

Trading Opportunity
USD/CHF

On a daily chart we can see that the pair is getting closer to a resistance trend line.

usd.chf d 6.4.17
Our tendency is to sell around this resistance.
How can we do that?
On an hour chart we are waiting for the pair to go a bit higher, towards the levels of 1.0090 – 1.0100 and to see a bearish divergence developing at the MACD and RSI.

usd.chf 1h 6.4.17
After that we we’ll be waiting to see a bearish pattern created and one which would be the trigger to a sell pair.


Daily market review – April 5th 2017

Trading And Investing

The Wall Street markets closed yesterday with a small rise, ahead of the meeting of US President Donald Trump and President of China.
The energy and raw materials sectors led the gains at the Dow Jones who closed up by 0.2%.
The S&P 500 and Nasdaq climbed by less than 0.1%.

The US trade deficit narrowed nearly 10 percent in February, as imports of cars and mobile phones plunged and exports jumped to a 26-month high, according to macroeconomic data released yesterday in the United States.

The Asian markets are down for the upcoming meeting of presidents of the United States and China tomorrow.
The Shanghai and Taiwan Stock Exchanges are rising after a holiday in the past two days.
The Japanese yen rising for a fourth straight day.

Trading Opportunity
EUR/GBP

The main trend of the pair is a rising trend as seen on the weekly char, where a triangle pattern is developing.
Our tendency is to join in with this trend.

eur.gbp w 5.4.17

When we go down to a daily time frame, we could try to schedule it.

eur.gbp d 5.4.17
We are waiting for pair will go above the higher line of the triangle, above the level of 0.8785.

Daily market review – April 4th 2017


wall-street-bull

Wall Street trading ended yesterday in price declines on the back of weak car maker shares.
The Dow Jones was unchanged at 20,650 points, the S&P 500 fell by 0.1% and the Nasdaq fell by 0.2%.

The trading in Asian stock exchanges is with a mixed trend, amid growing uncertainty about US trade relations with China and Japan under the Trump presidency.
Tokyo fell by 0.9%, Hong Kong rose by 0.6%, Shanghai climbed by 0.4%, Seoul fell by 0.2% After exports exceeded expectations in January.

The trading on the European stock exchanges is proceeding with slight gains, after yesterday’s indices closed down by 0.5%.
London is up 0.3%, Paris and Frankfurt are up 0.1%.

The Japanese yen is up by 0.3% against the US dollar to 110.4 yen per dollar.
The Euro is down 0.1% against the US dollar to $ 1.06 per euro.

Trading Opportunity

USD/CAD

Yesterday on 4 hours chart the USDCAD pair broke above a resistance diagonal line.

usd.cad 4h 4.4.16
On an hour chart, after we stretched the Fibonacci Extensions,  the pair have reached the Fibonacci level of 61.8. at 1.3440.

usd.cad 1h 4.4.417
The RSI is at an over-bought area, and a bearish divergence is developing the the MACD histogram.
Our tendency is to look for a bearish pattern to be created and then to enter with a put trade.